
Ready-made cycling training plans are gaining more and more popularity. They are a more economical alternative to full coaching. We can even have free access to many of them (such as Garmin plans, which are kind of free – free to users of Garmin devices). However, are these plans effective? I guess the best answer here is – it depends. Sometimes they can be extremely effective and sometimes not. This is because something called heterogeneity of training adaptations exists. In simple terms, different people respond differently to the exact same training. For this reason, one training plan can turn out to be extremely effective for us, and another may be a complete disaster. Nevertheless, it is worth getting to know this phenomenon better, because we can use this knowledge to improve the effectiveness of our training, or potentially choose the right one for us.
Currently, we have access to a very large number of ready-made training plans. One of the alternatives are Garmin plans, but this applies to any other ready-made training plan. Actually, it doesn’t really matter if it is a Garmin, Zwift, TrainerRoad, or any other ready plan, because the heterogeneity of the adaptations always applies.
It seems that it is really difficult to predict the adaptations, that any given plan would elicit in our specific case. In the literature, it is often noted that exactly the same training program leads to completely different training adaptations (Bouchard and Rankinen, 2001). Some authors even stated that such a phenomenon is the norm (Haugen et al., 2021) (and I agree with them 100%).
Therefore we must be aware, that potentially any given ready-made training plan, on the one hand, can turn out to be incredibly effective for us, and on the other hand, it can be quite the opposite.
In the next part, I will describe in more detail the issues related to the heterogeneity of the adaptations and I will list only some factors that may affect it (it is very complex, so I don’t think that it would be a complete list). I will also present arguments that, paradoxically, we can turn the knowledge about heterogeneity to our advantage by using an appropriate training strategy.
I want to point out that sometimes I’ve got quite off-topic. Sorry for that, but it’s actually related to the main problem. If want to get the essence just skip part “”
I must admit that most of the examples given are unfortunately based on studies conducted on sedentary people. Despite that, it seems that we can still get a lot of interesting information from them. In my opinion, this knowledge still can be applied to competitive cyclists.
Nevertheless, it doesn’t mean that there is no heterogeneity in the case of active endurance athletes.
In the case of a study conducted on professional cyclists (Rønnestad, 2020), it turned out that in the group using the recently popular “most effective” intervals 30/15, there were people who did not increase their 20 minutes power, although the group average indicated a clear improvement of this parameter. It means that some people increased their fitness using this program, and some don’t at all.
Another example is the work of V. Vesterinen et al. (2016), conducted on recreational runners. They investigated the effectiveness of the approach to training based on morning HRV measurements.
Although in the HRV guided group heterogeneity was still observed it was much less than in the standard training group. So even using the strategy that was developed to fight against heterogeneity, it was still observed.
There is no doubt, that heterogeneity of the training adaptations exists in the case of endurance athletes. Actually, my list of examples could be endless, because it is observed in most research papers related to endurance training programs. Personally, I don’t know any study that would present a standard deviation in training outcomes (for example VO2max, power at LT1, or any other performance metric) close to 0, which would be a sign that everyone improved similarly.
The problem is, although we observe heterogeneity in many examples, there aren’t many studies that would be researching the heterogeneity itself (for example reasons why it occurs) in the case of endurance athletes, so that’s the reason why I need to base my text mostly on studies conducted on not so much trained people.
I must admit, that there are some features of Garmin cycling training plans, that can help tailor them to our individual needs. For example, we can choose how many hours we have to train a week, we can choose the days in which we want to train, and we can also choose a day of a long ride.
These features are great, and I think that they are really advantageous to the more standard ready-made plans, because they enable us to personalize our plan. It can potentially reduce the heterogeneity of responses to these plans, but I’m afraid that is still not enough, because although plans are customizable, they all are based on fixed structure (I mean for example types of training sessions in the plan).
Another thing is that cycling plans don’t seem to be adaptable to how we actually respond to them. There are some performance tests scheduled, but it doesn’t seem, that they play any role in the adaptation of the plan to how we responded to it.
In the case of running Garmin training plans, we can choose one of the coaches that are supposed to tailor our plan, and it seems that our plan is adapted based on the training data (at least that is what I heard in this promotional video – https://youtu.be/LsonHs54QNU, but don’t even watch, because it is in Polish).
Nevertheless, I don’t believe that these coaches are doing the tailoring of the plans themselves, because how it would be possible for them to make plans for thousands of Garmin users around the world? I think that these plans are based on AI or algorithms.
HERITAGE family study
In the 1990s, a large study was conducted in the US and Canada. It was called HERITAGE (HEalth, RIsk factors, exercise Training And GEnetics) (Bouchard et al., 1995). In one of the publications that were written based on its results, training adaptations were analyzed among 481 people who previously led a sedentary lifestyle.
For 20 weeks, participants followed exactly the same training plan. Initially, the training consisted of 30 min at a heart rate corresponding to 55% VO2max, and later training dose was increased to 50 minutes with a heart rate associated with 75% VO2max. Throughout the experiment, the training frequency was 3 times per week.
Most people achieved an increase in VO2max within the range of 8-16%. Nevertheless, despite the use of the exact same training, some of them were not able to improve the tested parameter practically at all, and others increased their VO2 max by more than 42%.

These results show that, paradoxically, despite the use of the same training plan, we cannot necessarily expect the same adaptations among different people.
The authors noted that this heterogeneity has a genetic background, as the results indicated that adaptation to endurance exercise was inherited, although as I will describe later, this is only one of the potential factors influencing heterogeneity.
Responders and non-responders
Usually, people who did not improve their results (or the increase of the tested parameters was negligible) are referred to as non-responders, while those who positively responded to training are called responders.
However, it does not seem that a poor response to a given training program is permanent. In other words, it is not likely that there are people who are unresponsive to any type of training.
Whether a person will improve seems to depend on the context (Joyner & Lundby, 2018). For example, it was sufficient to increase the training volume among people who were initially qualified as non-responders to transform them into responders (Montero and Lundby, 2017).
In addition, one study compared the effects of low intensity only training program with an alternative method based on Tabata intervals (20/10 s sprints) (Bonafiglia et al., 2016).
It turned out that when analyzing group averages, both forms of training were comparably effective. However, in the context of individual cases, it was a totally different story.
It was a randomized crossover study, where each person applied two types of training (each participant used each method, but, training blocks were separated by a sufficiently long detraining).
While there were non-responders in the case of both programs, there wasn’t any case where someone would not improve at least one of the examined parameters after using both training methods. So that means that different training methods are effective in the case of different people.
Sometimes it also happens that the training was actually effective, but not in the context of the performance metric that we were examining (Pickering and Kiely, 2018). For example, even if a given training program was not effective in improving our VO2max, maybe the power at first lactate threshold increased significantly.
We can therefore miss positive adaptations to a given training program just because we have paid attention to a limited number (or just one) performance metric (eg. VO2max or 20 min power).
We can learn a lot also from the publication of Vollaard et al. (2009). They examined the effectiveness of a training program consisting of cycling on an ergometer among sedentary men.
The training program resulted in (if you made it that far it shouldn’t be a surprise for you) heterogeneity of responses, but the authors also noted that while the increase in VO2max and work performed during the 15-minute time trial (and therefore also power) often occurred simultaneously, no correlation was observed between the change in VO2max and the improvement in work during the time trial.
Therefore, it seems that 15 min power and VO2max can increase completely independently of each other, which is another example of why we cannot rely only on one performance indicator while assessing the effectiveness of our training program. If one metric improved (eg. VO2max) it doesn’t mean that other too, or on another hand, if one of them didn’t improve it does not necessarily mean that the other doesn’t.
Considering the above examples, the term non-responder seems to be inappropriate. There are hardly any people who are unresponsive to any type of training. If one type of training doesn’t work for one person, it doesn’t seem that other won’t. Just a little change to a training program can transform the non-responder into a responder.
As C. Pickering and J. Kiely (2019) noted, we should rather talk about people who did not respond to a given training program, and not about people who do not respond to training at all.
However, it should be mentioned here that the classification of people as responders and non-responders is unclear. Usually, a typical technical error of measurement (TEM) is used for this purpose. It is assumed that if a person obtains an increase of a given parameter higher than TEM (e.g. for VO2max it is usually around 5-6%), we consider him or her a responder. Nevertheless, this method definitely is not perfect (Bonafiglia et al., 2018).
Sometimes it also happens that different methods of classifying responders and non-responders can lead to the classification of one person into completely different groups (but of course response was the same) (Hecksteden et al., 2018).
Moreover, the observed heterogeneity of responses is influenced by the random variability in the measurement of a given parameter. On the one hand, it is influenced by the technical error of measurement, and on the other hand, by the natural biological variability (Atkinson and Batterham, 2015; Atkinson et al., 2019).
For this reason, the observed heterogeneity is not fully reflecting real heterogeneity
Therefore, those classified as non-responders may have actually improved their results. After all, probably to a small extent.
What we can learn from the section above? It seems that if we don’t see any positive adaptation to our training plan, we can just tweak it a little bit, and it should work out. For example, if we don’t see improvements, we can add a little training load to our plan (increase the amount of TSS we accumulating, either by increasing volume, intensity, or both) or just change the type of intervals we are doing, and that change could lead to positive adaptations.
Of course, strictly following one of Garmin’s plans (or any other ready-made plan) we can’t do that. Well, we can change it, but if we need to, what’s the point of getting a ready plan when probably we would need to do the planning ourselves (but obviously it doesn’t apply when the plan works for us). Nevertheless, the solution is to change the whole plan, when we don’t want to do the planning ourselves.
What factors influence the heterogeneity of responses?
There are many potential factors here because training adaptations are influenced by a huge number of different factors (Pickering and Kiely, 2017). Nevertheless, below I will mention a few of them, which also we have control over (for example heterogeneity is influenced by genetics, but we can’t do anything about that).
1. Poor regularity
If we do not follow our training plan and miss a large number of training sessions, it should be not a surprise for us that we didn’t get the anticipated results. The recipe for fixing that one is simple – just stick to the plan.
If one person performs a given training program 100%, while another only 75%, it should not surprise us that we will observe different training adaptations, despite the same training plan (Ross et al., 2019).
Of course, sometimes it’s better to not do the training at all costs because that could be also disadvantageous. For example, if our schedule unexpectedly becomes very tight, and we will try to do the training on top of it, our recovery could be impaired.
We can point out here one of the disadvantages of ready-made plans. They are prepared in advance and do not take into account various situations in which such a plan should be modified.
Nevertheless, when skipping training sessions will happen too often, it should not be a surprise that the plan may have turned out to be ineffective.
2. Incorrect selection of exercise intensity
It would seem that such a basic thing as the prescription of intensity during training, is extremely simple, but it turns out to be quite the opposite.
Usually, various types of training zones are used. There are different approaches that we can use here, for example, zones based on HRmax, FTP or FTHR. The problem is that a given zone system potentially could not coincide with the body’s physiological reactions during exercise.
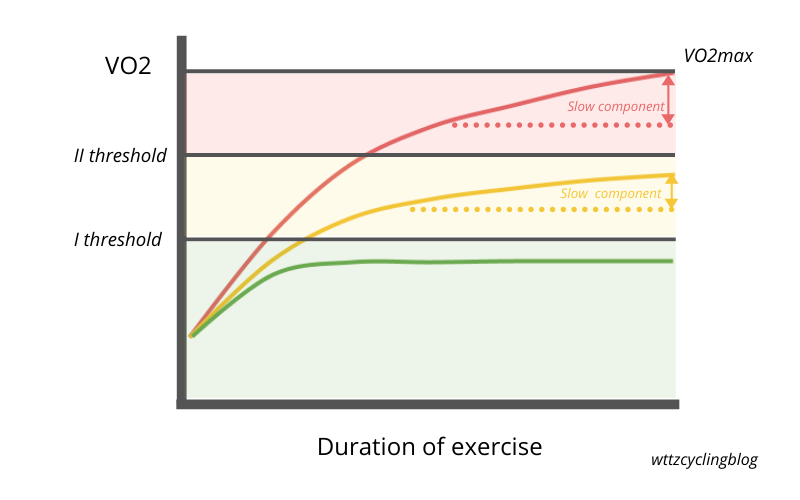
Generally, we can distinguish three (or in fact four), as you might call them, physiological training zones. They are based on two metabolic thresholds (Jamnick, 2019).

Exercise with different intensities related to thresholds will elicit different physiological reactions. When working below the first threshold (1 zone), we will observe resting lactate values, while VO2 (i.e. the use of oxygen during exercise) will be stable (actually at the beginning of the exercise it will rise monoexponentially quite fast, it is called VO2 fast component, but then it would be stable).
When we pass the first threshold (zone 2), we find that lactate will rise above the resting values, but it will eventually get a relatively stable value. In the case of VO2, we will be able to observe the so-called VO2 slow component but it will not lead to VO2max. This phenomenon is manifested by a slow increase in VO2, although theoretically, it should be stable.
If you work above the second metabolic threshold (zone 3), neither lactate nor VO2 will reach stable values, and the slow component will lead to the achievement of VO2max. In addition, we will observe changes in the concentration of phosphocreatine and inorganic phosphate in muscles, while their pH will decrease (Jones et al., 2008).
Short, very intense, sprint efforts (zone 4) will, on the other hand, cause relatively similar reactions as when working between thresholds (although the concentration of lactate may be higher here). Due to their short duration, we will not be able to achieve VO2max, despite the exhaustion.
Also, fatigue while exercising in each of the metabolic zones seems to be conditioned by different factors (Black et al., 2017).
You probably wondering how we define those thresholds. Well, there are a lot of methods of doing that. For example, I can list some of the methods related to the second threshold: Dmax, modified Dmax, Individual Lactate Threshold, MLSS, Lactate Minimum, 20 min FTP test, Critical Power. Although we have a lot of methods it seems that the best way of determining the first threshold is the first lactate threshold or GET (Gas Exchange Threshold), and for the second one, the best method is probably Critical Power, which I will describe briefly below (Poole et al., 2021).
Unfortunately, in the case of relying on ready-made systems of intensity zones, we are not entirely sure where the metabolic thresholds will be in their case.
The problem is well illustrated by the results of the study by D. Iannetta et al. (2020). It turned out that the Gas Exchange Threshold occurred at 60-90% of the maximum heart rate (HRmax) and 23-57% of the maximum power obtained in the progressive test to exhaustion (Wpeak), depending on the participant.
The case with MLSS (Maximal Lactate Steady State – method of estimating the second threshold) was similar. This parameter occurred at 75-97% HRmax and 44-71% Wpeak in different people.
It may therefore happen that, for example, two people training with the same% HRmax will actually be exercising in two different metabolic zones. Therefore, they will not actually achieve the same relative intensity.
For two different people, exactly the same training session may turn out to be a completely different physiological load. If it is a completely different training stimulus for them, we should not be surprised that the same training will cause significantly different effects.
Of course, both of the above methods are based on maximum values. Popularly used A. Coggan zones are based on FTP, which is one of the methods of determining the power value associated with the second metabolic threshold (or threshold heart rate in the case of FTHR) (Allen, Coggan, & McGregor, 2019).
This method is better than using e.g. HRmax, because here we refer to the estimated value of the second threshold, not the maximal value, and we know that this threshold could occur at different percentages of for example HRmax (but the same story is with the VO2max), but still, I am not sure if we are able to determine the% FTP associated with the first threshold in this case.
Certainly, the% FTP associated with the first threshold will differ from one person to another. We can’t say for example that the first threshold will occur at 75% of FTP in every case.
Low-intensity workouts are usually done just below the first threshold. The name of the second zone (endurance) in the quoted zone system suggests that we should do endurance training there. Its upper limit is 75% FTP. Perhaps most people training at such power will be below the first metabolic threshold, but personally, I am not completely sure about it. That’s why I don’t really know if we can clearly distinguish when we are training below, and when above the first threshold using Coggan’s zones.
There is also a problem when training above the second metabolic threshold. Let me use the example of Critical Power here. Nevertheless, we must be aware that one of the methods of determining FTP is analogous to the one used in the case of CP.
There are strong indications that Critical Power is the best method of determining the power related to the second metabolic threshold (Jones et al., 2019). Critical power, therefore, separates the effort that leads to a metabolic steady state from the one that destabilizes it.
The CP model, apart from Critical Power includes one more parameter called W ‘. In the past, it was considered a measure of anaerobic capacity, but experiments that manipulated the availability of oxygen during exercise showed that it affected the W ‘value. Hence, it certainly does not represent only and exclusively anaerobic capacity (Chorley and Lamb, 2020).
Nevertheless, W ‘is nothing more than the amount of work we can sustain before fatigue occurs, after exceeding the CP.
We can have two people. One person could have a low W’ and another one would have a high W’. A person with a high W’ will be able to maintain a higher percentage of CP, during maximal efforts above the second threshold. Let’s assume that a person with a high W’, could sustain for 5 min 125% of the Critical Power.
On the other hand, a person whose W ‘is rather low will only be able to maintain 115% of CP for 5 minutes. Let’s say that their plan consists of 5 × 5 minutes at 115% CP. It will turn out that one person will do this training without any problems, and the other will only manage to do only one interval. It will happen despite they theoretically doing the same intensity – 115% CP.
Thus, relying on on% FTP / CP to prescribe a training session above the second threshold can lead to achieving different exercise intensity from person to person. For some, such interval training may turn out to be too intense, and for others, this intensity may be insufficient.
If for people with different W’, different percentages of CP could mean different intensity, why we can’t just prescribe intervals above the second threshold based on W’?
Of course, it is possible using Philip Skiba’s model, which is able to determine changes in the W ‘during interval training (Chorley and Lamb, 2020). On this basis, we could design interval session that would reduce W’ to e.g. 20% of its initial value.
Even so, it seems that this approach is imperfect. At the 2019 ECSS conference in Prague (Bossi et al. 2019), the authors presented interesting results. In the study, even an approach based on the use of W ‘ for prescribing intervals intensity, turned out to lead to variable physiological responses.
However, I don’t think it was caused by the method itself, but maybe by some imperfection in the model. W’ behavior during interval sessions appears to be highly complex. It may also be the case that W ‘regenerates to a different extent and rate in different people (Chorley et al., 2020).
Other results presented at the same conference suggest that perhaps such a simple method as performing intervals with maximal sustainable intensity may lead to obtaining relatively similar physiological responses in different people (Hopker, 2019).
Although this approach isn’t researched well, it is identical to the methods used in the work of S. Seiler, who popularized the 4 × 8 min training (Seiler et al., 2013).
But how do we go about maximal sustainable intensity? The point is not to burn all matches during the first matches, but to achieve maximal average power during all intervals. So we should get relatively similar (or even increasing) power during all repetitions.
It’s like a time trial, but we pace ourselves during the whole interval session (time trial with recovery periods).
In practice, the first interval may seem relatively easy to perform, but with the last one, we will achieve maximum effort (although the power during all intervals will be at a similar level).
In such a way of performing interval training, the intensity will be regulated by the time of intervals. For example, a 4 × 8 min training session will then be more or less just above the second threshold, while a 4 × 4 min training session, would be somewhere at the upper limit of the 3rd metabolic zone.
It is worth mentioning here that we do not necessarily have to perform such training to exhaustion. We can do them almost maximally, which means that we do one interval less before we reach the maximum effort. This means that if we had to, we would do one more repetition, but we end the training at this point.
Another problem with FTP-based zones (but this also applies to FTHR) is that there are at least several methods of estimating FTP power.
We can use a 20-minute time trial and multiply average power by 95%, we can perform the same test, but with 5 min max effort in the warm-up, we can use CP modeling, or we can do a 1-hour time trial (although when we read the FTP definition closely, it makes completely no sense why it should be a 1-hour max power), we will probably get different FTP approximations.
Such discrepancies could also theoretically influence the effectiveness of the whole zone system.
All the above-mentioned problems can lead to a situation when the same ready-made training plan will elicit totally different adaptations in different people.
In my opinion, it is better to try to estimate both thresholds, than rely on ready, non-individualized zone systems
Regarding estimation, as I said earlier we have many options to choose from, but of course, some methods are more effective than others.
Although it is the best practice to go to the laboratory and test our first lactate threshold or GET, there are some methods of doing it noninvasively, and even at home.
On the one hand, we can use HRV analysis during the test progressive test to exhaustion, and on the other hand, we can use the Talk Test.
However, it seems that laboratory methods are more effective here.
As for estimating the second threshold, I believe that Critical Power is probably the best method of doing that. For its calculation, we need to do 3 to 5 maximum efforts lasting 3 to 15 min (Chorley and Lamb, 2020). So for example we can just do 3, 7 and 12 min time trials.
Originally, such tests were performed in the laboratory on an ergometer, but in practice, we can just go all out, either outdoors or on a trainer.
Max efforts should be done over the course of several days (although attempts have also been made to determine CP during one day, with a rest period between efforts).
The power obtained during the maximum tests will be used to determine CP and W ‘.
Tom Bell prepared a spreadsheet, which you can use for calculations (https://www.highnorth.co.uk/articles/critical-power-calculator). It’s probably for exchange for an email, but you can definitely use it (PS I highly recommend the High North blog).
This may be considered a shortcut, but the CP can also be determined from only 2 maximal efforts using a linear model (Clingeleffer et al., 1994; Simpson and Kordi, 2017). Here we can use 3 and 12 minutes.
The problem with this approach is that we will not then get a model fit value (R ^ 2), and the topic is often approached such that CP and W ‘are determined from the best fit model.
Nevertheless, the error in determining the CP, in my opinion, will be rather small. This is because in general, when calculating Critical Power the model fits are really high.
However, when during one exercise test we would have very low motivation and we would obtain a result significantly lower than our physiological maximum, then indeed the values of CP and W’ may be significantly skewed using that method.
The advantage of this approach is that we don’t need to perform as many maximal tests, so it is more practical. It may be less likely to interfere with our training (of course it depends on the individual case).
Another way of determining the second threshold is going to the lab. The Maximal Lactate Steady State has long been considered the “gold standard” of all laboratory methods of estimating it.
Nevertheless, this view has been challenged (Jones et al., 2019) and, as I previously noted, there are strong indications that the CP should be considered the “gold standard”.
Let’s back to the MLSS. We can, of course, determine its value in the laboratory, but it is completely impractical because 3 to 5 exercise tests with lactate measurement are required here.
For this reason, typically the maximum progressive tests to exhaustion are used to determine the second threshold. Generally, there are two types of methods of estimating it that way – one based on lactate, and one on gas exchange measurements.
Nevertheless, as I noticed earlier the number of different methods is huge. Referring to the second lactate threshold, in an article by O. Faude et al (2009), the authors distinguished at least 25 methods used in the literature to determine it.
In one study, different methods combined with different test protocols turned out to give totally different results, and only some of them were similar to the MLSS (which was the reference value in that particular case) (Jamnick et al., 2018).
What we can say about lab tests is that they are not perfect, and they are associated with some kind of error. We can’t really estimate power at the second threshold up to 1 W (but on the first one also). Well actually we can, but it’s just estimation, not the real value. To my knowledge, none of the currently used methods will allow us to do this, even Critical Power (but as I said, that it’s probably the best tool we have so far).
Although lab tests surprisingly are not perfect, the undoubted advantage of performing them is that we obtain the power/heart rate value related to both thresholds during one visit. In addition, we can also test VO2max.
If we want to estimate power or heart rate related to thresholds, I think that we can choose just the most convenient method of doing so. It seems that LT1/GET and CP combination is the best, but if another method is more practical for us, I think that we can use that as well.
When we have estimated power values at the first and second threshold, we can start to prescribe intensity based on them.
We can assume that low-intensity workouts are performed below the first threshold, medium-intensity workouts between the thresholds (the so-called tempo closer to the first of them, and the sweet spot closer to the second), and high-intensity workouts, above the second threshold (so-called VO2max intervals or zone). Sprints we can just perform as hard as possible.
In the case of Garmin’s or other ready-made plans, it will be difficult to use the threshold-based zone model, because the intensity in such plans is almost always prescribed based on the non-individualized zone system
In this case, we have to guess what intensity the author of the plan meant, and then we should rather be able to adjust it to our threshold-based method.
But the main question should be: is the threshold-based intensity zone model effective in practice? It seems that it is. For example in one study authors compared the intensity
prescription based on thresholds vs %heart rate reserve (Wolpern et al., 2015).
The performance outcome measured was VO2max, and as a responder, they classified a person who improved it by more than 5,9% (so that’s TEM, which I described earlier).
It turned out, that in a heart rate reserve group only 5 of 12 participants were classified as responders, whereas in the threshold group all participants were classified as responders.
That study shows us, that using a threshold-based model actually helps in reducing the heterogeneity.
3 Inappropriate training load management
A given training plan may lead to different adaptations among different people, also due to the inappropriate selection of training loads. As training loads, I mean all methods that combine the intensity with the volume of training (eg TRIMP, TSS, etc.).
We need to be aware that the relationship between fitness and the training load is often described as dose-response (similar to the case with drugs) (Bourdon et al., 2017).
Too little training load will not be a sufficient signal for our body to adapt, and thus will not allow us to improve fitness. On the other hand, too much training load won’t be optimal, as it may lead to overtraining.
However, this dose-response does not seem to be static, but it changes over time. If we are getting better and better, we will also need to increase the training load to elicit further adaptations.
Our body quickly adapts to stress, and if we want to increase our fitness level further, we need to challenge our bodies a little bit more.
This is shown by examples of professional athletes development, who seem to accumulate more and more training load every year, such as Thibaut Pinot (Pinot and Grappe, 2015).
Of course, we cannot immediately jump to a higher level of loads, because it may end with overtraining, so you should increase their amount slowly and gradually.
It doesn’t work like that if we aren’t good performers, and we will start accumulating training loads like pro athletes, which will allow us to reach the same fitness level as they have. It actually will probably lead to overtraining, and we will be even weaker than before.
The dose-response relationship will be influenced by many factors, such as our ability to regenerate or potentially the level of stress in life.
It also seems that if we get better, we will be able to tolerate more training loads. So if we have a better fitness level we need more and more training load to elicit adaptations, but we can tolerate more and more training load.
I can quote some indirect evidence, that in one study regeneration of HRV was inversely correlated with VO2max (Hautala et al., 2001). So in simple words, skiers with greater VO2max had more rapid HRV recovery after the race. We can guess that better athletes can also better tolerate the training load because they probably recover faster from accumulating a certain amount of load, but I must admit, that this study is quite a poor explanation of that phenomenon.
So how to determine the optimal level of loads for us? The answer is simple. If we observe an increase in fitness level and we don’t see any signs of overtraining, it means that the level of training loads is probably appropriate. Of course, this requires systematic measurement of our performance to spot certain trends in how our fitness changes over time.
However, what can this mean in the context of training plans, and heterogeneity of responses? Let’s assume that the chosen plan will have an average of 500 TSS per week (of course, in specific weeks this number will be higher or lower).
For one person it could be too much load, because of a lower dose-response relationship. He or she will not get the desired results but will become tired, and may even be overtrained. Maybe at that point in the time, 350 TSS/week would be appropriate for that person.
On the other hand, it could be too less training load for another person. Perhaps the optimal amount for him or her will be an average of 600-700 TSS per week, and the plan with 500 TSS, would be too low a dose, and it wouldn’t allow for improvement Probably that person will observe the stagnation of the fitness or even detraining.
We can see that when these two people will follow the same plan, they would get different results. Well, actually the results will be similar because it would be ineffective for them, but for different reasons. On the other hand for another person, 500 TSS could be appropriate, and he or she will improve following the same plan.
Once again we come to the observation that exactly the same training plan can lead to completely different results in different people.
If we want to use ready-made plans, it is so important to choose a ready plan following our characteristics. If we choose a plan that is too demanding for us, we will not achieve the expected results, and in the worst case, we will get overtrained.
If, on the other hand, we choose a plan that is not ambitious enough, it will not allow us to achieve further improvement and we may experience stagnation or detraining.
The description of the ready-made training plans usually indicates who they are intended for (e.g. beginner, intermediate, etc.). In addition, the number of weekly hours that we will spend training is also indicated.
Choosing a plan that potentially best fits our characteristics in terms of training loads will not yet prove whether it will be effective for us or not, but it will significantly increase the probability that it will actually be so.
4 Mismatched training method and model
If we perform 100% of the recommended workouts, properly prescribe intensity, and use optimal training load, we still cannot be sure whether the plan will be effective in our particular case or not.
I will return once again to the example cited earlier. In one study, it turned out that both in the case of low-intensity training and the one based on Tabata sprints, there were people who were classified as nonresponders (Bonafiglia et al., 2016).
However, there was no such a case, that someone wouldn’t significantly improve at least one of the performance metrics after using both forms of training.
It, therefore, seems that different people may respond positively to different types of training. For some, long intervals between thresholds (the so-called tempo or sweet spot) may work. For others, short intervals above the second threshold (the so-called VO2max), could be effective. There may be also people who respond well to 30 s Wingate-style sprints.
It may be equally important what intensity distribution we achieve (ie. how much training we spend doing low, medium, and high-intensity stuff).
Some people may be able to tolerate high frequency and amount of intense work, for others it may be better to rely on a more low-intensity focused training program while maintaining the relatively little amount of intensive work.
Generally, we can distinguish several training models relating to the zone system based on metabolic thresholds (Stöggl and Sperlich, 2014, 2015).
They are:
volume training;
threshold training;
HIIT training;
polarized training;
pyramidal training.
The above models differ in the duration/training sessions of training performed in the individual intensity zones defined by the thresholds. Of course, different percentages are usually given, e.g. of the time or number of training sessions in individual zones, but we should not be too concerned with the exact numbers.
Different ways of determining intensity distribution can lead to different results (as in Race Across America case study – Manunzio et al., 2016), and I don’t think that we know what method is the best. That’s why in my mind we should only focus on the main assumptions of each model, and not worry about if it is a 78/22 low/high-intensity ratio or 80/20, that’s completely irrelevant.
Volume training is characterized by the fact that the vast majority of training time is spent with intensity below the first metabolic threshold, while the amount of medium and high-intensity training is negligible here. Usually, due to the low intensity, a higher training volume is used here, and that’s the reason why it is called that way.
The name of threshold training is a bit misleading. It is not necessarily about training exactly on the first or second threshold, but rather the main focus is to train with the intensity between thresholds.
On the other hand, in HIIT training, the greatest attention is paid to training above the second threshold, while low and medium-intensity training sessions are kind of neglected.
Polarized and pyramidal training are similar to each other. In both cases, we focus mainly on low-intensity exercise, while the share of medium and high-intensity training will be slightly different in both cases.
In pyramidal training, we spend more time training between thresholds and a little less time exercising above the second threshold. On the other hand, in the case of polarized training, the opposite is true – we place more emphasis on efforts above the second threshold, and slightly less on the effort between thresholds.
Of course, by reading research papers on this topic, one can quickly conclude that polarized training is the most effective training model (Seiler, 2010; Neal et al., 2013; Stöggl and Sperlich, 2014). Nevertheless, other data show that pyramidal training is a very frequently used model among endurance athletes (Stöggl and Sperlich, 2015), and polarized training has not always proved to be more effective than pyramidal training (Treff et al., 2017).
In the light of the heterogeneity of responses to endurance training programs, we cannot assume, that a given training model will be the most effective for us.
Likely, some people can potentially respond well to polarized training and others to threshold training. The model doesn’t really matter as long as it is effective.
We can’t stop doing something when it is working, even if it makes completely no sense from a scientific point of view. The point of training is to improve determinants of performance, and if we achieve that, and also do not get overtrained, we can certainly say that this program was effective for us.
But there’s a caveat to that. We can meet the assumptions of a given model by doing different types of training. For example, in the case of polarized training, we can use, short intervals above the second threshold (3-5 min or 30/15 s type of training) or long intervals (e.g. 4 × 8 min, 3 × 10 min).
If we add a large amount of training below the first threshold, in both cases we will meet the assumptions of the polarized model, but Different types of intervals may be differently effective for different people and probably some of them may work better or worse in a given case. So despite the fact of using the same model of intensity distribution, we can still have different training effects.
How to use the knowledge about heterogeneity?
Paradoxically, we can use the knowledge about heterogeneity to our advantage. Thanks to it, we can apply an appropriate strategy of choosing ready-made plans or develop them by ourselves.
As the above examples show, it is rather difficult to predict whether a given training plan will be effective for us or not.
However, we know that one approach to training may turn out to be ineffective, but it isn’t probably the case, that we wouldn’t respond to other types of training.
For this reason, I am more and more inclined to the belief of J. Kiely (2012), which originally referred to the periodization of training, but I think that it can also be applied in the context of any training plan.
You can see an interesting podcast in which the author himself explains this problem ( https://youtu.be/VlaLUAaUe1k ).
Classically, a given training plan is determined in advance, months before the target competition. In fact, we assume in that it will turn out to be effective, but actually, we can predict the adaptations. So maybe, a slightly better approach is to keep adapting the plan to how we respond to it, and not choose one and hope that we will respond.
This requires constant monitoring of our progress because we need some way of evaluating its effectiveness. If a given training plan is effective at a given moment, we should continue it. When we observe that our performance does not necessarily improve, then something in our plan should be changed.
Perhaps we need to increase the training load. If this does not lead to an increase in form, perhaps you should think about either changing the training model or using different interval training.
In this way, by constantly manipulating our training program and adjusting it to how we actually adapt to it, we can obtain a theoretically continuous improvement in fitness, because we will be constantly trying to optimize training for performance.
I will describe that approach in more detail later on, but firstly let’s dive into possible ways of evaluating our performance
Ways to monitor progress
As I mentioned earlier in monitoring our progress, we cannot limit ourselves to only one performance metric, because a given training program may be effective in improving one of them, and another will remain at the same level.
So what possibilities do we have here? One solution here is to do the popular 20-minute FTP test. We can observe how our 20 min power changes over time and on this basis we will be able to determine our progress.
Perhaps, however, it is better to apply Critical Power here. Firstly, in addition to the estimated power value associated with the second metabolic threshold, we will obtain information about W ‘. Usually, training either leads to an increase in CP or W ‘, while the simultaneous increase in both parameters is rather rare (Puchowicz et al., 2018). Another thing is that to calculate CP we need to do at least 2 to 3 maximal tests. So when we would do for example 3, 7, and 12 min time trials, we have a lot of data to interpret.
When using 20 min test, we just get one metric, 20 min max average power (and FTP, but it’s just multiplied by 0,95 max 20 min power). It could happen that our FTP from that test will stagnate, and we will assume that the training was ineffective. But in fact, when we would use CP it could turn out, that yes maybe our CP is constant, but W’ increased. On the other hand, our 20 min power will be the same, but maybe our 7 min power improved.
So in some situations, we can assume that our plan was ineffective only because we limit ourselves to only one performance metric.
Another useful performance metric is the first lactate/ventilatory or gas exchange threshold. Here, unfortunately, we will be forced to visit the laboratory, so monitoring this parameter will certainly not be possible to take place often. However, during such tests, we can obtain information on another parameter that affects the results in endurance sports, i.e. VO2max.
Nevertheless, the HRV threshold, i.e. one of the methods of estimating the power value at the first metabolic threshold, seems to change with increasing fitness (Fronchetti et al., 2007).
Its measurement does not require a visit to a laboratory, so it would be potentially easier to monitor regularly.
Another potentially important determinant of performance in cycling is so-called “durability”. Especially on long road races, it is important to be able to maintain high power after having done a lot of previous work. It is noted that higher-level road cyclists possess some kind of endurance which allows them to lose little power (relative to generating it fresh) despite a lot of previous work done (van Erp et al., 2021).
Even if all other performance metrics would be the same after training, it may turn out that we increased this type of endurance, which in turn may be helpful in longer races.
However, I do not know any formal test that would allow us to measure such endurance. Nevertheless, inspired by the work of I. Clark (2019), I came up with something like this.
I checked how my maximum power of 3 min max drops after 2 hours of exercise below the first threshold (I referred to the HRV threshold here). After 15 minutes of warming up, I made the first 3 minutes of maximum effort. It turned out 381 W.
Then for the next 2 hours, I rode with power below the HRV threshold. The first 10 minutes after the effort, I rode with any low power to recover a bit, but then I kept the power as usual during low-intensity training.
Then I made another 3-minute max effort. It turned out that I obtained 369 W. I do not know if such a test is able to measure the previously mentioned type of endurance, but I am curious whether with the training I will lose less power during its duration (link to Strava: https://www.strava.com/activities/5478798183 ).
Maybe there’s something to it because later on I did 403 W during the first effort, and 410 W, during the second one (which is quite weird) (https://www.strava.com/activities/5822656273/analysis)
The selection of 3 minutes of effort was not accidental here. Earlier in the same week, I did a 12-minute max test. Thanks to this, I was able to determine the CP from two efforts: one shorter and one longer.
Nevertheless, 3 min max effort could be too short for that kind of test. In one of the studies, it was indicated, that after prolonged endurance exercise, higher-level cyclists, had less power drop, than weaker performers, especially for longer (>5 min) duration efforts (Mateo-March, et al., 2022). So it seems that durability could be manifested more in the case of a little bit longer efforts.
Another important element in the case of road cycling (but not only) is the ability to recover quickly after hard efforts with power above the second threshold.
In a road race, we surge and then recover many times, whether due to the attacks or the characteristics of the route itself (acceleration after entering a corner).
Often we are dealing here with a nonuniform effort, with periods of high intensity above the second threshold, separated by periods with a lower intensity between the thresholds or below the first.
Therefore, it seems that an important element may also be the ability to repeat high-intensity efforts and lose not much power during repeated surges.
However, it is hard to say how exactly such repeatability could be measured, but Stephen Seiler in one of the films described a way of using the cumulative work above Critical Power and a certain factor ( https://youtu.be/oPhNv8Rf6YY , https://youtu.be/0yld_eI9cr8 ).
Another thing that Stephen Seiler noticed is that with training, the heart rate drift (i.e. the increase in heart rate despite holding the same power) observed during long, low-intensity workouts appears to be delayed on the one hand, and it is somewhat less substantial as training progresses (https://youtu.be/yvOPYEbRHzI , 25:00).
Therefore, perhaps during long low intensity training sessions, it is worth paying attention to when the drift occurs, and how much our heart rate increases.
Most of the above-mentioned determinants of fitness cannot be monitored very often (perhaps apart from heart rate drift during a long training session). However, there is a simple test, that we can perform relatively often (even every week), and also it is related to the actual performance (at least 40 km of the time trial) (Lamberts et al., 2011).
LSCT (Lamberts and Lambert Submaximal Cycling Test) is a submaximal test based on the relationship between heart rate, power, and RPE during exercise. It lasts only 15 minutes and consists of 3 phases:
6 min at 60% HRmax;
6 min at 80% HRmax;
3 min at 90% HRmax.
Of course, I mentioned before that HRmax percentages are a poor way of determining exercise intensity, but in the context of this test, they will work great.
The great advantage of this test is that it is not maximal. It is rather like a harder warm-up. Because of that, we can do it very often (e.g. every week).
Apart from the first minute of each segment (because the heart rate needs to stabilize), we simply need to measure the average power we generate at a certain heart rate value.
At the end of each segment, we should also measure our rate of perceived exertion (RPE) The problem is that the original G. Borg scale is protected by a license and we shouldn’t download copies from the Internet.
Nevertheless, we may use as well the scale modified by C. Foster (Foster, 2001). At first glance, it is identical to the Borg scale, but there are actually differences between them.
Although the Foster scale usually is used as a tool for measuring training loads and then we measure it about 30 minutes after exercise, there is nothing wrong with using it also during exercise.
The scale looks like this:
0 – rest
1 – very, very easy
2 – easy
3 – moderate
4 – somewhat hard
5 – hard
6 – *
7 – very hard
8 – *
9 – *
10 – maximal
You should print it or just use a pdf, to be able to see it during the exercise. Then around 20 s before the end of each test segment you should give a score that describes the best how you feel.
It is worth pointing out here that you need to look at the verbal anchor first, and only then give your score.
But how can this test help us with monitoring our progress? Well, a decrease in submaximal heart rate is a common adaptation to endurance training (or rather, in this version of the test, an increase in power at a given heart rate) (Bouchard and Rankinen, 2001).
As our performance improves, we will see that the power at the same heart rate level will increase.
But why do we still need to measure RPE here? This is because a decrease in submaximal heart rate does not always mean an increase in performance. After all, sometimes it is quite the opposite – it can be a sign of fatigue.
In the case when we increase our training loads quite rapidly, the phenomenon of the so-called parasympathetic hyperactivity is observed (Le Meur et al., 2013). In that state our HRV increases significantly, resting heart rate decreases, and we also observe a decrease in heart rate during exercise.
This is well illustrated by the case study of a cyclocross cyclist (Lamberts et al., 2010). During weeks with high training loads, the power in the test was paradoxically higher, despite obvious fatigue. It looked like the cyclist was increasing his performance, but it turned out that despite a higher power, he also had higher RPE during tests.
In the case when our power at submaximal heart rate increases, but RPE also, it is a sign of fatigue, not necessarily improvement of fitness level.
When we would limit ourselves to monitoring only power and heart rate, it could lead us to misinterpretations, as an increase in power at a certain heart rate could indicate functional overreaching (FOR), and not a performance improvement.
It is worth also noting that when functional overreaching occurs it may happen that it will be very difficult for us to reach 90% HRmax at all.
Still, FOR is characterized by the fact that an initial drop in performance is reversed after taking a recovery period, and the performance level gets higher than it was before the training block. So it is not that bad after all. The worse scenario is NFOR (non-functional overreaching) or overtraining syndrome.
To sum it up. By combining power, heart rate, and RPE, we can conclude from this test that:
if our power increases and RPE is the same or decreases, it means an increase in performance;
if the power increases, but RPE as well, it may be a sign of fatigue/functional overreaching;
if the power decreases and the RPE increases, it is probably detraining.
Moreover, the results at 80 and 90% of HRmax were more strongly correlated with the results obtained in the 40 km time trial than the power in the first segment (also at 90% stronger than at 80%) (Lamberts et al., 2011).
Therefore, it is better to analyze the changes in the second and third test segments, as the power during the first segment may not necessarily reflect the real performance changes.
It is worth mentioning here that the classical test also consisted of measuring HRR (Heart Rate Recovery), i.e. how quickly our heart rate drops after ceasing the exercise. But the power itself during the test was a better predictor of results in the 40 km time trial, so maybe it’s not worth measuring HRR.
Personally, I use a variation of this test. I don’t measure power at a given heart rate, but heart rate at a given power.
In such a case instead of choosing %HRmax, we can use powers, that correspond to low, medium, and high intensity for us.
We choose power for each of the 3 segments (for example 150, 220, 290 W), and we perform all the tests with the same power.
As the training progress, we should see some changes in our heart rate at certain powers.
Only when the heart rate during the 3rd segment drops below 80% of HRmax, we should think to “recalibrate” the test and chose a higher power, because then its relationship with the improvement of results probably decreases.
It is also worth noting here, that the best approach is to do this test on a turbo trainer because that way we can reduce a lot of factors, that could influence results. We can of course do it outdoors, but I think that the data could be quite noisy.
Training strategy based on heterogeneity
When we know how to measure our performance, we can use the strategy, that I described earlier in the text.
At first, we need to choose some kind of plan. We can use a ready-made one or develop such a plan ourselves. It doesn’t really matter what exactly this plan would be, because we will be just checking if it actually works. Nevertheless, it is better to choose or develop one with the amount of training load, that we think would be best for us.
But it is always better to be conservative with load, because if it won’t be enough, we just increase it, and shortly after we should get a positive response. On the other hand, if we get overtrained, it takes a lot of time to recover.
As training progresses we should perform tests to evaluate the effectiveness of the plan. We can perform for example LSCT once a week, and a CP test every 4 weeks. From time to time, we can also test the power related to the first metabolic threshold (although this is just a suggestion for the selection of tests, we can of course choose other tests).
We need to monitor how the tested parameters change along with our training. If we are seeing an increase in performance metrics, we shouldn’t change anything in our plan. If it’s working we don’t need to modify it at all (until it stops working).
When we see that performance metrics don’t improve with time, we should think about making some adjustments to our plan. Of course, it takes time for the adaptations to occur. If, for example, after 1 week of training our power in the LSCT does not improve, it doesn’t mean that it won’t in the following weeks.
It is difficult to define here the time after which we can consider that a given training program has turned out to be ineffective. However, it seems to me that if we do not see any improvement for 8 weeks (i.e. two popularly used 3 + 1 mesocycles), then something is definitely wrong.
This is a conservative limit as we could take 4 weeks here as well. Probably it would allow us to make slightly faster decisions in relation to modifying our training program.
So what to do when our plan stops working? First, I will refer to the situation when we develop a plan ourselves. We need to make some changes to it. At the very beginning, ask yourself if you prescribed the intensity the right way. And what about consistency? If you skipped a lot of sessions, maybe that’s the reason why you don’t see improvement.
However, if we have done above mention things right, and still don’t get any better, we should increase the training load. We need to be careful with that because although an increase in training load is necessary for performance improvement when we increase it too much, it could lead us to overtrain.
If we have increased the load and still do not improve, maybe it is worth thinking about changing the entire training model. For example, if we did polarized training, let’s move to the pyramidal model. We used short intervals above the second threshold, let’s replace them with longer “sweet spots”.
In this way, by constantly manipulating our plan and adapting it to how we respond to it, we can potentially optimize our performance outcomes.
This strategy is similar to a PDCA (Plan-Do-Check-Act) Deming Cycle. You firstly plan your training and then follow the plan. Along with training, you check if it is working, and then act. If it’s effective, then you continue that, if it’s not, you keep changing something, until it’s become effective.
I know that the above description can be quite vague, that’s why I’ll describe how I implemented that approach to my training, and what results I got so far.
At the end of 2020, I got COVID. Then I was coughing for two months, and I was unable to do the training. The break from training lasted for 3 months, and after that, I started almost from 0 in February 2021.
From the first day of my training, I employed the strategy that I described above. I need to mention that I was also using HRV to guide my training, but I don’t think that I had a really big influence on the results. It definitely helped, but I don’t believe it was something groundbreaking.
Firstly I prepared some kind of plan. It wasn’t doing much, because it was consisting of one session with LSCT, and 3 low-intensity training sessions of around 45 min. It wasn’t either much volume or intensity, but actually, it worked, because my heart rate at 270 W during LSCT was decreasing for the first weeks of training.
In the third and fourth week of training, I did some performance tests (step test, 20 min FTP test, and 2 min max test), so the training load was a bit higher here.
But then I assumed, that my low-intensity sessions would last 60 min, a long ride 2 hours, and I would do two interval sessions – one 3×8 min almost maximal (like I would do 4×8 min maximal, but I stop one interval before), and one consisting LSCT and 10 min at around 110% of my FTP.
I also make some assumptions regarding the sequencing of the training sessions based on HRV measurements, similar to the approach of Kiviniemi et, al. (2007). I was modifying my approach, but I came up with something like this:
– if HRV (RMSSD) is above 10 days rolling average I did intervals;
– if the next day it was still above this threshold I did a long ride, but if it was below I did a short low-intensity ride;
-after intervals and long ride I always did a short easy training session;
– I trained a maximum of 7 days back to back, and then I did a rest day, but if HRV was below the threshold for two days I also rested.
I also was using 3+1 periodization scheme. 3 weeks of training, one recovery week (but sometimes it was 2+1).
I kept doing that as long as I couldn’t spot an improvement in the LSCT. I wasn’t increasing the training load the classical way for example 10% increase each week (for example in TSS, but I used back then session RPE), and -50% during recovery week. I was doing the same thing all the time until it stopped working.
After a couple of weeks, it indeed became ineffective. So I increased the training load. I lengthen my long ride to 2h and 30 min and started doing 4×8 min interval session instead of 3×8 min. Surprisingly it really quickly lead to improvement in LSCT, so I started doing that type of training all the time until it stopped working.
Then besides increasing the training load I changed the type of intervals. I started doing 3×20 min at 90% of Critical Power, and 2×35 min at 85% of CP.
The strategy was simple. I kept doing the same thing over and over again until I saw that it isn’t effective anymore, and in that situation, I made adjustments to my plan. Most of the time I was just increasing my training load (for example I was lengthening my long rides or adding intervals/lengthening them), and it worked surprisingly well, but as I mentioned before once I changed the type of intervals I was doing.
I started using this approach in February of 2021, and now in April of 2022, I’m doing something like this. Usually, I do 2-3 intervals sessions per week. I choose between 4×8 min almost max, 4×20 min at 90% of CP, and 2×35 min at 85% of CP. I also lengthened my long rides to 3 h.
I still use HRV to guide my training, but now, if it’s above the threshold I do an intervals-long ride-intervals combo, and then I’m doing a short low-intensity ride. Now I’m accumulating around 400-500 (sometimes a little bit less) TSS a week, which isn’t a massive load, but I don’t care, because it works.
Along with LSCT testing, I was doing Critical Power tests, and I will present to you the evolution of CP and W’ in the table below:
| Date | CP | W’ |
| 25.02.2021 | 237 W (but it was FTP estimated from 20 min test) | – |
| 05.04.2021 – 11.04.2021 | 298 W | 15,2 kJ |
| 14.06.2021 – 16.06.2021 (after one week of easy training following one week complete break) | 301 W | 14,4 kJ |
| 19.7.2021 – 21.7.2021 | 311 W | 17,8 kJ |
| 18.08.2021 – 20.08.2021 | 319 W | 16,3 kJ |
| 29.10.2021 – 31.10.2021 | 322 W | 17 kJ |
| 31.12.2021 – 09.01.2022 | 334 W | 16,6 kJ |
| 04.04.2022 – 11.04.2022 | 352 W | 16,3 kJ |
We can see that this training strategy was indeed effective. Maybe the fitness improvement wasn’t that rapid, but over a longer period, it was quite substantial (at least for me, but I know that it isn’t something spectacular). In one year I managed to increase my CP around 50 W. I must admit that there were periods when my fitness deteriorated, but it was due to not enough training, not due to ineffective training. I was just getting detrained, but fortunately, that approach never lead to symptoms of overtraining in my case.
Previously using more conventional methods I was getting comparable or sometimes even better fitness gains, but the problem was that they never lasted long. I’ve got a peak of fitness, and then it was only getting worse and worse until I took a post season break. But using this approach I feel that my fitness grows slowly, but constantly and gradually.
I’ve also noticed, that Garmin’s VO2max is a really good performance metric. I don’t know if it is a good VO2max estimator, but from my experience, it works like LSCT, and when I see bigger VO2max estimate numbers, my RPE and heart rate during intervals decreases, I feel stronger, and I also can see improvement in CP.
The interesting fact is that apart from 3+1 scheme I didn’t use any form of periodization. I didn’t build any peaks of fitness, but it seems that it was a rather constant slow increase in performance (but apart from periods that I just wasn’t doing enough training).
Time will tell if it would be effective in the future.
Applying this strategy to ready-made training plans is perhaps a bit less suited. Following these assumptions, failure to improve results would mean switching to a completely different plan.
We must remember one thing here. If we stop following a given plan in the middle and start another one from the beginning, we will probably deal with a much lower amount of training load. This is because plans usually use load progression, so at the begging plan of the plan, we are accumulating less load, than at the end of it.
However, such changing of ready-made plans may turn out to be the most effective use, because firstly we will be able to stop something that does not bring us benefits, and secondly, we may come across a plan that, for some reason, is extremely effective for us.
We can also try to make some changes on our own, based on the existing plan, which has the potential to turn it into a program that brings us desired results.
All in all, it is worth remembering two principles:
“If it ain’t broke, don’t fix it”, and we need to remember that something that worked in the past may not be as effective in the future.
The first rule state that it is better not to try changing something in the plan if it actually work. If, we do not see any signs of overtraining and we observe an increase in performance we should not change anything. Sometimes such changes can turn out to be counterproductive for us.
Also, we can’t assume that what has been working in the past, will continue to do so in the future (Pickering and Kiely, 2017). For this reason, we should not stick to certain training methods that indeed were effective in the past, but now they just don’t work anymore. But with rule number one in mind, if something that worked in the past is still effective, let’s not change it.
It is also worth noting that such a strategy is nothing more than a trial and error method. Searching for suitable training methods in this way can be time-consuming. Nevertheless, at the moment it seems to be the best approach to tailoring the training to the individual characteristics of the person.
Nevertheless, perhaps in the future, based on genetic information, we will be able to match the training method to a given person, so that it is as likely to be effective as possible, before applying any type of training (Pickering et al., 2019). Now we can just guess what type of training we should start with, and then check if it is effective. If it’s not we just need to apply some changes and monitor our progress.
Bibliography:
- Bouchard, C., & Rankinen, T. (2001). Individual differences in response to regular physical activity. Medicine and science in sports and exercise , 33 (6 Suppl), S446 – S453. https://doi.org/10.1097/00005768-200106001-00013
- Haugen, T., Sandbakk, Ø., Enoksen, E., Seiler, S., & Tønnessen, E. (2021). Crossing the Golden Training Divide: The Science and Practice of Training World-Class 800- and 1500-m Runners. Sports medicine (Auckland, NZ) , 10.1007 / s40279-021-01481-2. Advance online publication. https://doi.org/10.1007/s40279-021-01481-2
- Vesterinen, V., Nummela, A., Heikura, I., Laine, T., Hynynen, E., Botella, J., & Häkkinen, K. (2016). Individual endurance training prescription with heart rate variability. Medicine and science in sports and exercise , 48 .
- Rønnestad, BR, Hansen, J., Nygaard, H., & Lundby, C. (2020). Superior performance improvements in elite cyclists following short ‐ interval vs effort ‐ matched long ‐ interval training. Scandinavian journal of medicine & science in sports, 30 (5), 849-857.
- Bouchard, C., Leon, AS, Rao, DC, Skinner, JS, Wilmore, JH, & Gagnon, J. (1995). The HERITAGE family study. Aims, design, and measurement protocol. Medicine and science in sports and exercise, 27 (5), 721–729.
- Bouchard, C., An, P., Rice, T., Skinner, JS, Wilmore, JH, Gagnon, J., Pérusse, L., Leon, AS, & Rao, DC (1999). Familial aggregation of VO (2max) response to exercise training: results from the HERITAGE Family Study. Journal of applied physiology (Bethesda, Md.: 1985) , 87 (3), 1003–1008. https://doi.org/10.1152/jappl.1999.87.3.1003
- Rønnestad, BR, Hansen, J., Stensløkken, L., Joyner, MJ, & Lundby, C. (2019). Case Studies in Physiology: Temporal changes in determinants of aerobic performance in individual going from alpine skier to world junior champion time trial cyclist. Journal of applied physiology (Bethesda, Md.: 1985) , 127 (2), 306-311. https://doi.org/10.1152/japplphysiol.00798.2018
- Bonafiglia, JT, Nelms, MW, Preobrazenski, N., LeBlanc, C., Robins, L., Lu, S., Lithopoulos, A., Walsh, JJ, & Gurd, BJ (2018). Moving beyond threshold-based dichotomous classification to improve the accuracy in classifying non-responders. Physiological reports , 6 (22), e13928. https://doi.org/10.14814/phy2.13928
- Hecksteden, A., Pitsch, W., Rosenberger, F., & Meyer, T. (2018). Repeated testing for the assessment of individual response to exercise training. Journal of Applied Physiology , 124 (6), 1567-1579.
- Atkinson, G., & Batterham, AM (2015). True and false interindividual differences in the physiological response to an intervention. Experimental physiology , 100 (6), 577–588. https://doi.org/10.1113/EP085070
- Joyner, MJ, & Lundby, C. (2018). Concepts About V˙O2max and Trainability Are Context Dependent. Exercise and sport sciences reviews , 46 (3), 138–143. https://doi.org/10.1249/JES.0000000000000150
- Montero, D., & Lundby, C. (2017). Refuting the myth of non-response to exercise training: ‘non-responders’ do respond to higher dose of training. The Journal of physiology , 595 (11), 3377-3387. https://doi.org/10.1113/JP273480
- Bonafiglia, JT, Rotundo, MP, Whittall, JP, Scribbans, TD, Graham, RB, & Gurd, BJ (2016). Inter-Individual Variability in the Adaptive Responses to Endurance and Sprint Interval Training: A Randomized Crossover Study. PloS one , 11 (12), e0167790. https://doi.org/10.1371/journal.pone.0167790
- Pickering, C., & Kiely, J. (2018). Exercise Response Efficiency: A Novel Way to Enhance Population Health ?. Lifestyle genomics , 11 (3-6), 129–135. https://doi.org/10.1159/000501206
- Vollaard, NB, Constantin-Teodosiu, D., Fredriksson, K., Rooyackers, O., Jansson, E., Greenhaff, PL, Timmons, JA, & Sundberg, CJ (2009). Systematic analysis of adaptations in aerobic capacity and submaximal energy metabolism provides a unique insight into determinants of human aerobic performance. Journal of applied physiology (Bethesda, Md.: 1985) , 106 (5), 1479-1486. https://doi.org/10.1152/japplphysiol.91453.2008
- Pickering, C., & Kiely, J. (2019). Do Non-Responders to Exercise Exist-and If So, What Should We Do About Them ?. Sports medicine (Auckland, NZ) , 49 (1), 1-7. https://doi.org/10.1007/s40279-018-01041-1
- Atkinson, G., Williamson, P., & Batterham, AM (2019). Issues in the determination of ‘responders’ and ‘non ‐ responders’ in physiological research. Experimental physiology , 104 (8), 1215-1225.
- Pickering, C., & Kiely, J. (2017). Understanding personalized training responses: can genetic assessment help ?. The Open Sports Sciences Journal , 10 (1).
- Ross, R., Goodpaster, BH, Koch, LG, Sarzynski, MA, Kohrt, WM, Johannsen, NM, Skinner, JS, Castro, A., Irving, BA, Noland, RC, Sparks, LM, Spielmann, G. , Day, AG, Pitsch, W., Hopkins, WG, & Bouchard, C. (2019). Precision exercise medicine: understanding exercise response variability. British journal of sports medicine , 53 (18), 1141–1153. https://doi.org/10.1136/bjsports-2018-100328
- Jamnick, N. (2019). An examination of current methods to prescribe exercise intensity: validity of different approaches and effects on cell signalling events associated with mitochondrial biogenesis (Doctoral dissertation, Victoria University).
- Jones, AM, Wilkerson, DP, DiMenna, F., Fulford, J., & Poole, DC (2008). Muscle metabolic responses to exercise above and below the “critical power” assessed using 31P-MRS. American journal of physiology. Regulatory, integrative and comparative physiology , 294 (2), R585 – R593. https://doi.org/10.1152/ajpregu.00731.2007
- Black, MI, Jones, AM, Blackwell, JR, Bailey, SJ, Wylie, LJ, McDonagh, ST, Thompson, C., Kelly, J., Sumners, P., Mileva, KN, Bowtell, JL, & Vanhatalo, A. (2017). Muscle metabolic and neuromuscular determinants of fatigue during cycling in different exercise intensity domains. Journal of applied physiology (Bethesda, Md.: 1985) , 122 (3), 446–459. https://doi.org/10.1152/japplphysiol.00942.2016
- Poole, D. C., Rossiter, H. B., Brooks, G. A., & Gladden, L. B. (2021). The anaerobic threshold: 50+ years of controversy. The journal of physiology, 599(3), 737-767.
- Iannetta, D., Inglis, EC, Mattu, AT, Fontana, FY, Pogliaghi, S., Keir, DA, & Murias, JM (2020). A Critical Evaluation of Current Methods for Exercise Prescription in Women and Men. Medicine and science in sports and exercise , 52 (2), 466–473. https://doi.org/10.1249/MSS.0000000000002147
- Allen H., Coggan AR, McGregor S. (2019). Training and racing with a power meter. VeloPress;
- Jones, AM, Burnley, M., Black, MI, Poole, DC, & Vanhatalo, A. (2019). The maximal metabolic steady state: redefining the ‘gold standard’. Physiological reports, 7 (10), e14098. https://doi.org/10.14814/phy2.14098
- Chorley, A., & Lamb, KL (2020). The Application of Critical Power, the Work Capacity above Critical Power (W ‘), and its Reconstitution: A Narrative Review of Current Evidence and Implications for Cycling Training Prescription. Sports (Basel, Switzerland) , 8 (9), 123. https://doi.org/10.3390/sports8090123
- Simpson, LP, & Kordi, M. (2017). Comparison of Critical Power and W ‘Derived From 2 or 3 Maximal Tests. International journal of sports physiology and performance, 12 (6), 825–830. https://doi.org/10.1123/ijspp.2016-0371
- Clingeleffer, A., Mc Naughton, L., & Davoren, B. (1994). Critical power may be determined from two tests in elite kayakers. European journal of applied physiology and occupational physiology, 68 (1), 36–40. https://doi.org/10.1007/BF00599239
- Faude, O., Kindermann, W., & Meyer, T. (2009). Lactate threshold concepts. Sports medicine, 39 (6), 469-490.
- Jamnick, NA, Botella, J., Pyne, DB, & Bishop, DJ (2018). Manipulating graded exercise test variables affects the validity of the lactate threshold and V˙ O 2 peak. PloS one, 13 (7), e0199794.
- Poole, DC, Burnley, M., Vanhatalo, A., Rossiter, HB, & Jones, AM (2016). Critical Power: An Important Fatigue Threshold in Exercise Physiology. Medicine and science in sports and exercise , 48 (11), 2320–2334. https://doi.org/10.1249/MSS.0000000000000939
- Bossi, AH, Hopker, JG, Passfield, L. (2019). Current methods to individualise exercise intensity are inappropriate for exhaustive interval training. 24th Annual ECSS Congress Prague / Czech Republic, July 3-6 2019;
- Chorley, A., Bott, RP, Marwood, S., & Lamb, KL (2020). Physiological and anthropometric determinants of critical power, W ′ and the reconstitution of W ′ in trained and untrained male cyclists. European Journal of Applied Physiology , 120 (11), 2349-2359.
- Hopker, J. (2019). Acute and chronic responses to individualized training prescriptions. 24th Annual ECSS Congress Prague / Czech Republic, July 3-6 2019.
- Seiler, S., Jøranson, K., Olesen, BV, & Hetlelid, KJ (2013). Adaptations to aerobic interval training: interactive effects of exercise intensity and total work duration. Scandinavian journal of medicine & science in sports, 23 (1), 74-83.
- Wolpern, A. E., Burgos, D. J., Janot, J. M., & Dalleck, L. C. (2015). Is a threshold-based model a superior method to the relative percent concept for establishing individual exercise intensity? a randomized controlled trial. BMC sports science, medicine & rehabilitation, 7, 16. https://doi.org/10.1186/s13102-015-0011-z
- Bourdon, PC, Cardinale, M., Murray, A., Gastin, P., Kellmann, M., Varley, MC, … & Cable, NT (2017). Monitoring athlete training loads: consensus statement. International journal of sports physiology and performance , 12 (s2), S2-161.
- Pinot, J., & Grappe, F. (2015). A six-year monitoring case study of a top-10 cycling Grand Tour finisher. Journal of sports sciences , 33 (9), 907-914.
- Hautala, A., Tulppo, M. P., Mäkikallio, T. H., Laukkanen, R., Nissilä, S., & Huikuri, H. V. (2001). Changes in cardiac autonomic regulation after prolonged maximal exercise. Clinical Physiology, 21(2), 238-245.
- Stöggl, TL, & Sperlich, B. (2015). The training intensity distribution among well-trained and elite endurance athletes. Frontiers in physiology, 6, 295. https://doi.org/10.3389/fphys.2015.00295
- Stöggl, T., & Sperlich, B. (2014). Polarized training has greater impact on key endurance variables than threshold, high intensity, or high volume training. Frontiers in physiology , 5 , 33. https://doi.org/10.3389/fphys.2014.00033
- Manunzio, C., Mester, J., Kaiser, W., & Wahl, P. (2016). Training intensity distribution and changes in performance and physiology of a 2nd place finisher team of the race across America over a 6 month preparation period. Frontiers in physiology, 7, 642.
- Seiler S. (2010). What is best practice for training intensity and duration distribution in endurance athletes ?. International journal of sports physiology and performance, 5 (3), 276–291. https://doi.org/10.1123/ijspp.5.3.276
- Neal, CM, Hunter, AM, Brennan, L., O’Sullivan, A., Hamilton, DL, De Vito, G., & Galloway, SD (2013). Six weeks of a polarized training-intensity distribution leads to greater physiological and performance adaptations than a threshold model in trained cyclists. Journal of applied physiology (Bethesda, Md.: 1985), 114 (4), 461-471. https://doi.org/10.1152/japplphysiol.00652.2012
- Treff, G., Winkert, K., Sareban, M., Steinacker, JM, Becker, M., & Sperlich, B. (2017). Eleven-Week Preparation Involving Polarized Intensity Distribution Is Not Superior to Pyramidal Distribution in National Elite Rowers. Frontiers in physiology, 8, 515. https://doi.org/10.3389/fphys.2017.00515
- Kiely J. Periodization paradigms in the 21st century: evidence-led or tradition-driven? Int J Sports Physiol Perform. 2012 Sep; 7 (3): 242-50. doi: 10.1123 / ijspp.7.3.242. Epub 2012 Feb 16. PMID: 22356774.
- Puchowicz, MJ, Mizelman, E., Yogev, A., Koehle, MS, Townsend, NE, & Clarke, DC (2018). The Critical Power Model as a Potential Tool for Anti-doping. Frontiers in physiology , 9 , 643. https://doi.org/10.3389/fphys.2018.00643
- Fronchetti, L., Nakamura, FY, De-Oliveira, FR, Lima-Silva, AE, & De Lima, JR (2007). EFFECTS OF HIGH-INTENSITY INTERVAL TRAINING ON HEART RATE VARIABILITY DURING EXERCISE. Journal of Exercise Physiology Online, 10 (4).
- van Erp, T., Sanders, D., & Lamberts, RP (2021). Maintaining Power Output with Accumulating Levels of Work Done Is a Key Determinant for Success in Professional Cycling. Medicine and science in sports and exercise, 10.1249 / MSS.0000000000002656. Advance online publication. https://doi.org/10.1249/MSS.0000000000002656
- Clark, IE, Vanhatalo, A., Thompson, C., Joseph, C., Black, MI, Blackwell, JR,… & Jones, AM (2019). Dynamics of the power-duration relationship during prolonged endurance exercise and influence of carbohydrate ingestion. Journal of Applied Physiology , 127 (3), 726-736.
- Mateo-March, M., Valenzuela, P. L., Muriel, X., Gandia-Soriano, A., Zabala, M., Lucia, A., … & Barranco-Gil, D. (2022). The Record Power Profile of Male Professional Cyclists: Fatigue Matters. International Journal of Sports Physiology and Performance, 1(aop), 1-6.
- Lamberts, RP, Swart, J., Noakes, TD, & Lambert, MI (2011). A novel submaximal cycle test to monitor fatigue and predict cycling performance. British journal of sports medicine, 45 (10), 797–804. https://doi.org/10.1136/bjsm.2009.061325
- Foster, C., Florhaug, JA, Franklin, J., Gottschall, L., Hrovatin, LA, Parker, S., Doleshal, P., & Dodge, C. (2001). A new approach to monitoring exercise training. Journal of strength and conditioning research, 15 (1), 109–115.
- Le Meur, Y., Pichon, A., Schaal, K., Schmitt, L., Louis, J., Gueneron, J., Vidal, PP, & Hausswirth, C. (2013). Evidence of parasympathetic hyperactivity in functionally overreached athletes. Medicine and science in sports and exercise , 45 (11), 2061–2071. https://doi.org/10.1249/MSS.0b013e3182980125
- Lamberts, RP, Rietjens, GJ, Tijdink, HH, Noakes, TD, & Lambert, MI (2010). Measuring submaximal performance parameters to monitor fatigue and predict cycling performance: a case study of a world-class cyclo-cross cyclist. European journal of applied physiology, 108 (1), 183–190. https://doi.org/10.1007/s00421-009-1291-3
- Kiviniemi, A. M., Hautala, A. J., Kinnunen, H., & Tulppo, M. P. (2007). Endurance training guided individually by daily heart rate variability measurements. European journal of applied physiology, 101(6), 743–751. https://doi.org/10.1007/s00421-007-0552-2
- Pickering, C., & Kiely, J. (2017). Understanding personalized training responses: can genetic assessment help ?. The Open Sports Sciences Journal , 10 (1).
- Pickering, C., Kiely, J., Grgic, J., Lucia, A., & Del Coso, J. (2019). Can Genetic Testing Identify Talent for Sport ?. Genes , 10 (12), 972. https://doi.org/10.3390/genes10120972
Heya!
I stumbled upon your blog and this is some seriously well researched information + personal experience. Thank you for putting this out there. I haven’t yet read the post in detail but if any questions come I will post them here.